Tagalaya Island
A Living Laboratory for Coastal Resilience and Environmental Innovation
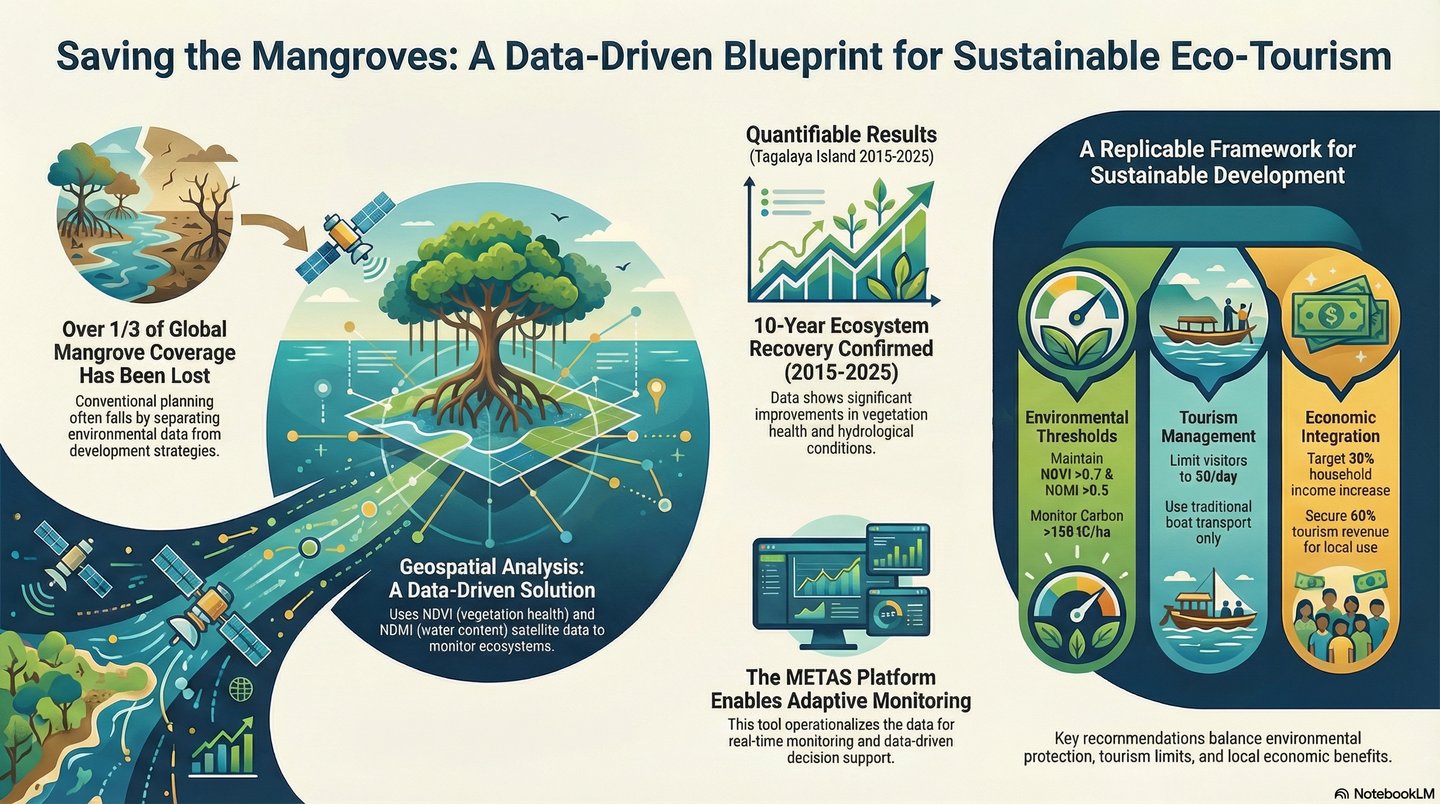
Preserving Green and Sustaining Life
Tagalaya Island serves as a dynamic ecological observatory for Indonesia’s sustainable future. Leveraging satellite-based vegetation indices, this project monitors and visualizes changes in environmental health across years.
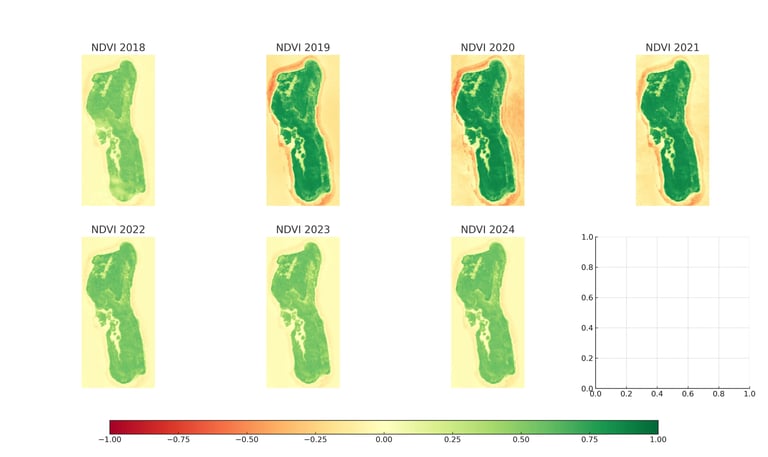
NDVI Monitoring (2018–2024)
Normalized Difference Vegetation Index (NDVI) offers insights into vegetation vigor and ecosystem resilience. The visualization shows significant shifts in greenness patterns across Tagalaya Island. The greener the region, the healthier the vegetation:
📊 Key Observations:
2018–2019: Stable vegetation cover.
2020–2022: Localized decline possibly linked to coastal pressure or dry periods.
2023–2024: Recovery signs in northern and central sectors.
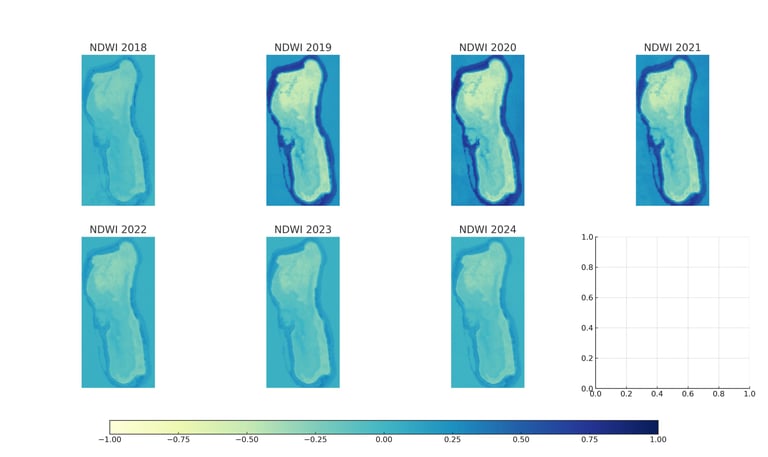
NDWI Monitoring (2018–2024)
Normalized Difference Water Index (NDWI) highlights water bodies and soil moisture. This helps in identifying hydrological shifts, particularly in mangrove areas, wetlands, and buffer zones.
📊 Key Observations:
Gradual increase in surface moisture post-2021, indicating possible recovery.
Some dry zones in 2020–2021 align with NDVI decline.
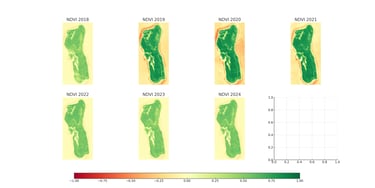
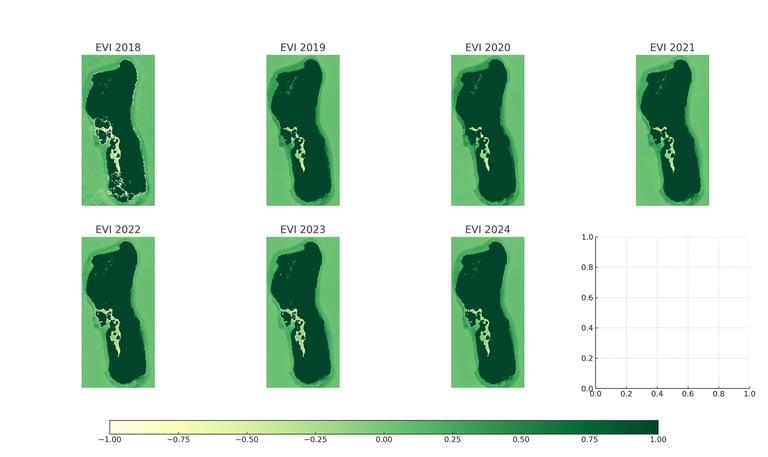
Enhanced Vegetation Index (EVI) provides refined insights into vegetation dynamics by correcting for canopy background and atmospheric influences. This index is especially useful in densely vegetated areas such as Tagalaya Island. The visualization reveals temporal fluctuations in vegetation health over a seven-year period:
📊 Key Observations:
2018–2019: Consistently high vegetation density across the island, with minimal fluctuations.
2020–2022: Moderate decline in vegetation intensity, particularly in southern coastal zones, potentially due to stress events or seasonal impacts.
2023–2024: Marked improvement in EVI values, indicating regrowth and ecological resilience, especially in central and eastern areas.
EVI Monitoring (2018–2024)
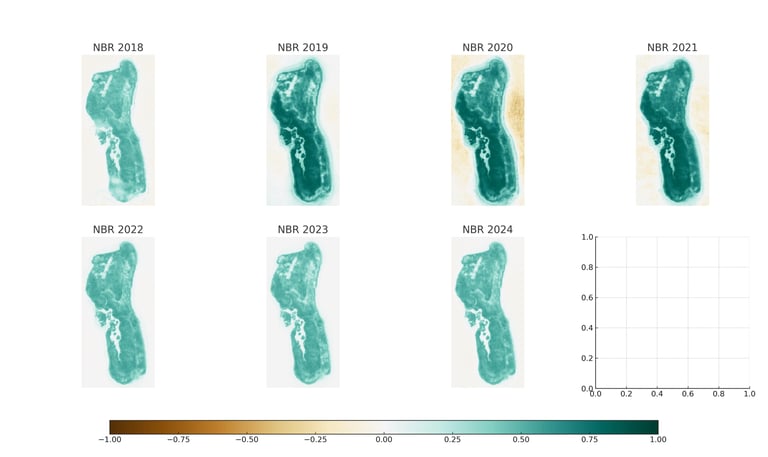
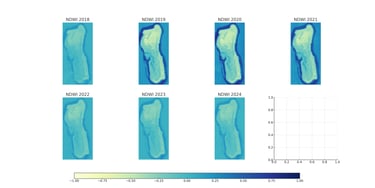
Normalized Burn Ratio (NBR) is a spectral index designed to detect burned areas, post-fire regrowth, and vegetation stress. It is especially effective in monitoring ecological disturbances and recovery in coastal and forested ecosystems such as Tagalaya Island. The visualization illustrates temporal variations in NBR values over seven years.
📊 Key Observations:
2018–2019: Stable NBR values across most regions, indicating limited disturbance or fire-related stress.
2020–2022: Noticeable decline in NBR in central and southern areas, possibly reflecting vegetation stress, degradation, or hydrological shifts.
2023–2024: Gradual improvement in NBR values, suggesting early signs of ecological recovery or stabilization, especially near mangrove edges and lowland zones.
NBR Monitoring (2018–2024)
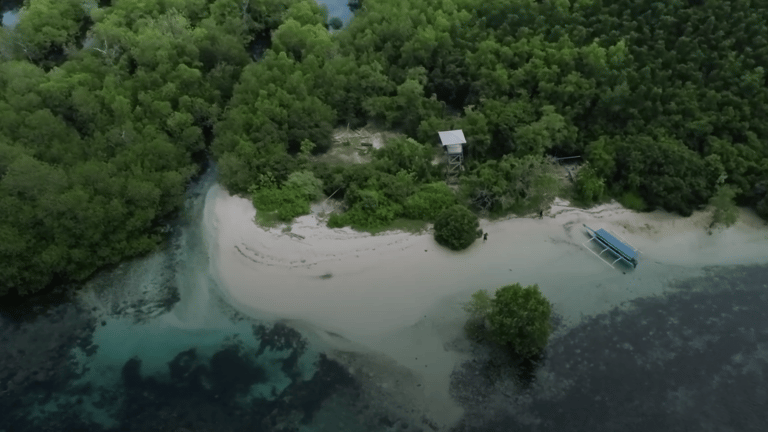
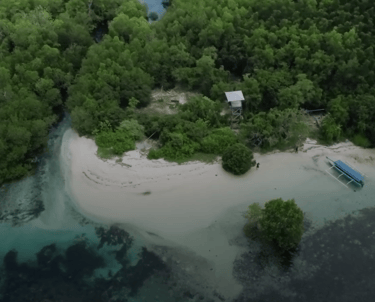
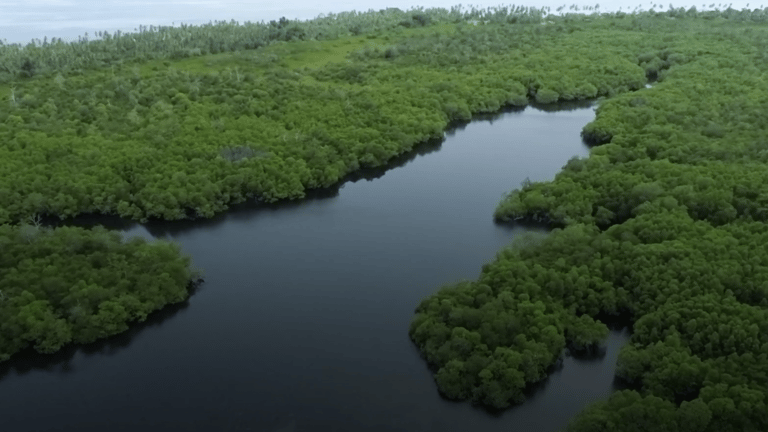
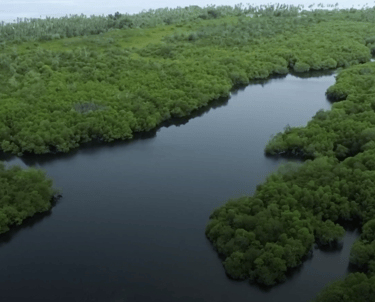
Ground Verification using Aerial Drone Videography